
Appearance
Cabin Analytics API
Cabin provides a read-only API for accessing your data. Analytics responses are aggregated (just like how they are stored and viewed in the dashboard) and are available in JSON format.
On the Free plan, use AI/MCP access instead. It's included on every plan and can answer the same questions in plain language.
API Key
To use the API, you need to create an API key in the API keys settings section of your account.
Each key is read-only and can be scoped to all of your domains or limited to specific ones.
API keys aren't used for AI/MCP access. Agents sign in with OAuth instead, and need no key at all.
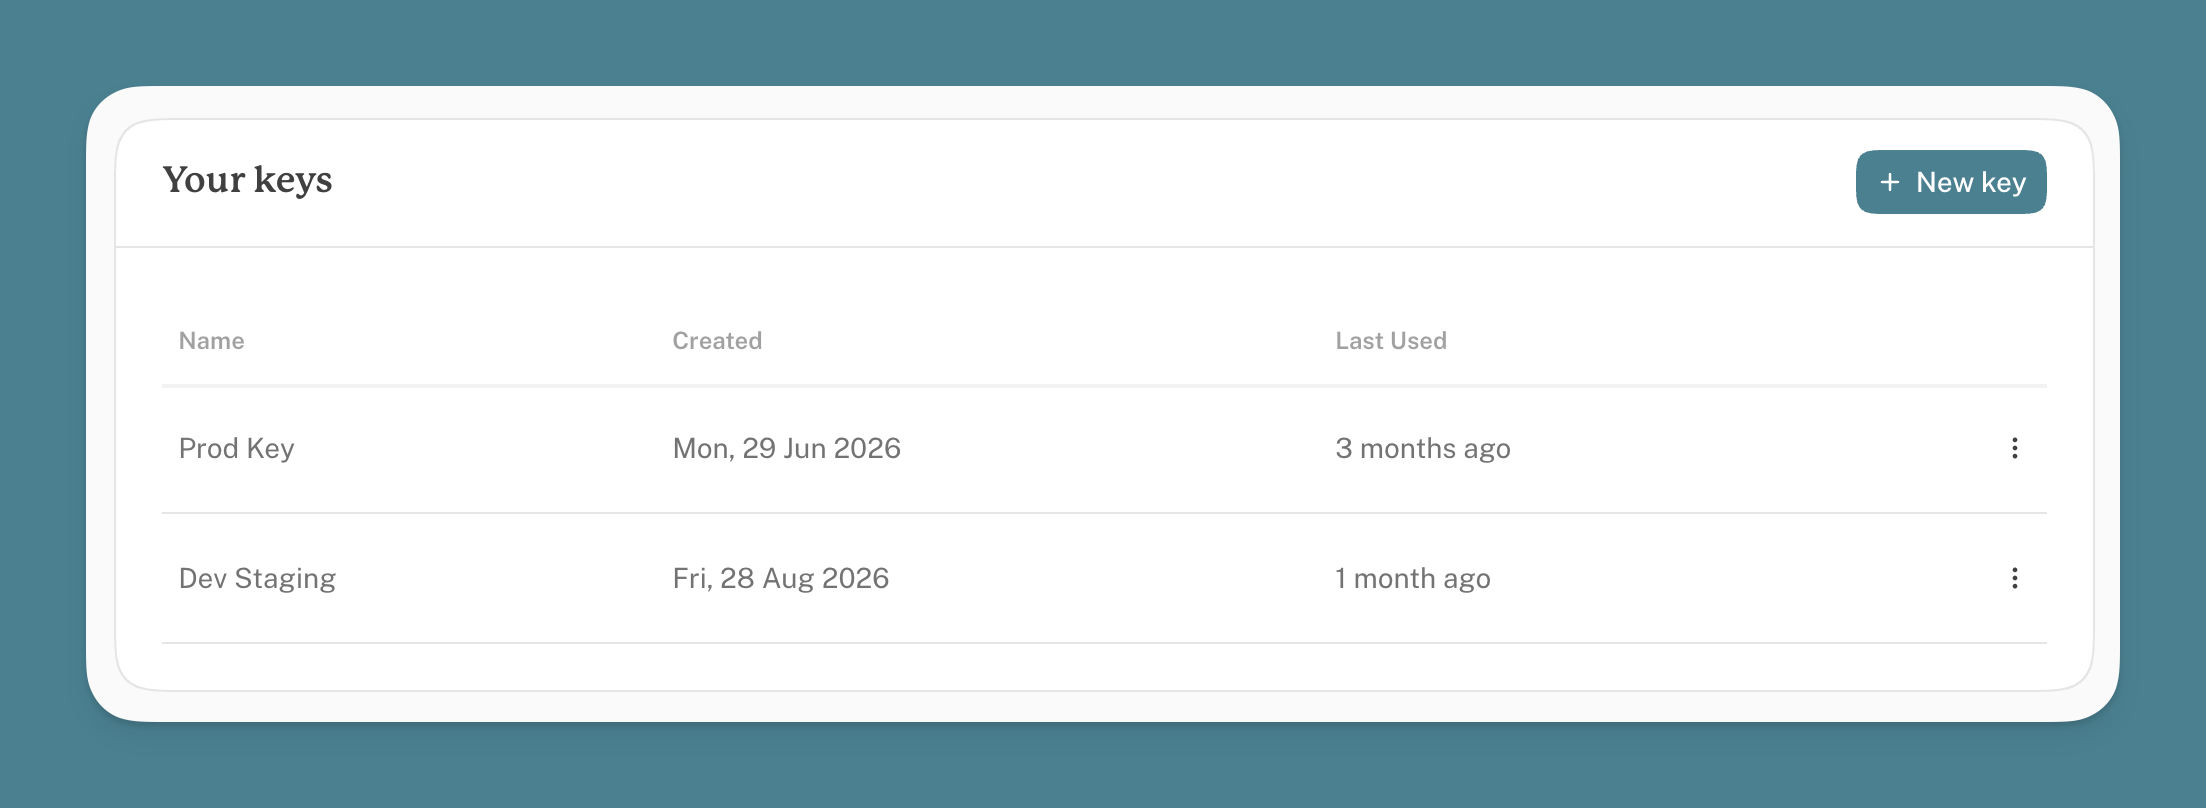
- Select 'New Key'
- Give your key a name
- Select which domains you want to grant access to
- Click 'Create'
Authentication
To authenticate your requests, you need to include your API key in the x-api-key header of your requests.
Example request:
bash
curl -X GET "https://api.withcabin.com/v1/analytics?domain=example.com&date_from=2025-01-01&date_to=2025-02-01&scope=core&limit_lists=20" -H "x-api-key: YOUR_API_KEY"Endpoints
The api is available at https://api.withcabin.com/v1/{endpoint}.
/analytics
This endpoint returns aggregated data about your website's traffic between two dates, including aggregated daily data for pageviews and bounces.
Query Parameters
domain
string requiredThe domain name for which you want to retrieve analytics data.
date_from
string requiredThe start date for the data (format: YYYY-MM-DD).
date_to
string requiredThe end date for the data (format: YYYY-MM-DD).
scope
string optionaldefault: core - The scope of the data. Can contain any combination of core,pages,referrals,events.
limit_lists
number optionaldefault: 50 - The number of items to return in each list. Values above 250 aren't rejected, but responses get large and slow, so treat 250 as the practical ceiling.
This affects countries, languages, browsers, operating_systems, devices, screen_sizes, pages and referrals.
Percentages in the response remain contextual to the entire dataset regardless of the limit.
About Scope
The scope pages and referrals add additional data for individual paths on your domain - see the Example Response. These are slightly heavier so we recommend using core unless you need the additional data.
Energy emissions data is only available with the pages scope.
Scroll depth also comes with pages, in two places: a scroll_depth object on each page, and a site-wide scroll_depth at the top level. The site-wide one is summed over every page before limit_lists is applied, so it does not match the sum of the pages you were sent.
events returns your custom events, each with a breakdown of the pages it fired on. It reads the same underlying data as pages, so asking for pages,events together costs no more than asking for either one.
The AI agent breakdown comes back under core, with no extra request. These hits are counted separately from summary.page_views and are never billable, so ai_agents does not sum into your pageview total, and each percentage is a share of agent traffic rather than of all traffic.
Example Response
json
{
  query: {
    domain: "example.com",
    date_from: "2025-01-01",
    date_to: "2025-02-01",
    scope: "core,pages,referrals",
    limit_lists: 10
  },

  /* Available with scope: core */

  summary: {
    page_views: 1959,
    unique_visitors: 1165,
    bounces: 817,
    bounce_rate: 0.29871244635193134
  },
  daily_data: [
    {
      timestamp: 1735689600000,
      page_views: 22,
      unique_visitors: 16,
      bounces: 12,
      bounce_rate: 0.75
    },
    {
      timestamp: 1735776000000,
      page_views: 29,
      unique_visitors: 26,
      bounces: 23,
      bounce_rate: 0.88
    },
    {
      timestamp: 1735862400000,
      page_views: 24,
      unique_visitors: 16,
      bounces: 13,
      bounce_rate: 0.81
    }
  ],
  screen_sizes: {
    small: 38,
    medium: 372,
    large: 463
  },
  devices: {
    desktop: 873,
    mobile: 288,
    tablet: 4,
    smart_tv: 0,
    console: 0,
    wearable: 0
  },
  browsers: [
    {
      name: "Chrome",
      value: 718
    },
    {
      name: "WebKit",
      value: 117
    },
    {
      name: "Firefox",
      value: 85
    }
  ],
  operating_systems: [
    {
      name: "Windows",
      value: 467
    },
    {
      name: "Mac OS",
      value: 365
    },
    {
      name: "iOS",
      value: 223
    }
    // ...
  ],
  countries: [
    {
      code: "GB",
      value: 362
    },
    {
      code: "US",
      value: 263
    },
    {
      code: "JP",
      value: 41
    }
    // ...
  ],
  languages: [
    {
    code: "en",
      value: 887
    },
    {
      code: "ja",
      value: 37
    },
    {
      code: "ru",
      value: 32
    }
    // ...
  ],
  traffic_sources: {
    email: 0,
    search: 217,
    social: 151,
    unknown: 789
  },
  ai_agents: [
    {
      name: "ChatGPT",
      hits: 34,
      percentage: 0.9444
    },
    {
      name: "Claude",
      hits: 2,
      percentage: 0.0556
    }
  ],

  /* Available with scope: pages */

  energy: {
    page_count: 22,
    green_hosting: {
      url: "nicmulvaney.com",
      hosted_by: "Cloudflare",
      hosted_by_website: "https://www.cloudflare.com",
      partner: null,
      green: true,
      hosted_by_id: 779,
      modified: "2025-03-17T20:24:22",
      supporting_documents: [
        {
          id: 18,
          title: "Blog post - The Climate and Cloudflare",
          link: "https://blog.cloudflare.com/the-climate-and-cloudflare/"
        },
        {
          id: 1264,
          title: "Cloudflare 2023 Emissions Inventory",
          link: "https://s3.nl-ams.scw.cloud/tgwf-web-app-live/uploads/Cloudflare_2023_Emissions_Inventory.pdf?X-Amz-Algorithm=AWS4-HMAC-SHA256&X-Amz-Credential=SCWT1WBAW6NZ5SW5GYJ8%2F20250317%2Fnl-ams%2Fs3%2Faws4_request&X-Amz-Date=20250317T202736Z&X-Amz-Expires=3600&X-Amz-SignedHeaders=host&X-Amz-Signature=0d3b2ffd9a885dbc41193e0e72bdee9c4ee8cf37671af3d092453578cc5a179c"
        }
      ]
    },
    average_time_spent_ms: 122892,
    average_co2_grams: 0.0708,
    total_co2_grams: 138.65,
    total_distance_km: 0.55,
    total_kettles: 4,
    transferred_bytes: 1145572683,
    total_bytes: 22060595,
    duration_total_ms: 240746383,
    duration_count: 1272
  },
  pages: [
    {
      path: "/page/1",
      page_views: 271671,
      unique_visitors: 243070,
      average_duration_seconds: 123,
      total_bytes: 8.2,
      co2_grams: 538,
      page_views_percentage: 0.12,
      scroll_depth: {
        average_percentage: 46.2,
        measured_visits: 1840,
        reached_at_least: [
          { percent: 0, visitors_percentage: 100 },
          { percent: 10, visitors_percentage: 88.37 },
          { percent: 20, visitors_percentage: 79.08 },
          { percent: 30, visitors_percentage: 73.75 },
          { percent: 40, visitors_percentage: 69.18 },
          { percent: 50, visitors_percentage: 65 },
          { percent: 60, visitors_percentage: 57.83 },
          { percent: 70, visitors_percentage: 52.61 },
          { percent: 80, visitors_percentage: 46.63 },
          { percent: 90, visitors_percentage: 38.86 },
          { percent: 100, visitors_percentage: 22.01 }
        ]
      }
    },
    {
      path: "/page/2",
      page_views: 167111,
      unique_visitors: 150073,
      average_duration_seconds: 147,
      total_bytes: 4.82,
      co2_grams: 222.6,
      page_views_percentage: 0.08
    },
    {
      path: "/page/3",
      page_views: 106361,
      unique_visitors: 93743,
      average_duration_seconds: 97,
      total_bytes: 4.82,
      co2_grams: 133.4,
      page_views_percentage: 0.05
    },
    // ...
  ],

  // Site-wide, summed over every page, not only the ones in `pages`.
  scroll_depth: {
    average_percentage: 41.8,
    measured_visits: 94211,
    reached_at_least: [
      { percent: 0, visitors_percentage: 100 },
      // ... one row per decile ...
      { percent: 100, visitors_percentage: 18.4 }
    ]
  },

  /* Available with scope: referrals */

  referrals: [
    {
      source: "Google",
      page_views: 259,
      unique_visitors: 197,
      has_utm: false,
      page_views_percentage: 0.39
    },
    {
      source: "LinkedIn",
      page_views: 252,
      unique_visitors: 136,
      has_utm: false,
      page_views_percentage: 0.38
    },
    {
      source: "com.linkedin.android",
      page_views: 34,
      unique_visitors: 18,
      has_utm: false,
      page_views_percentage: 0.05
    },
    // ...
  ],

  /* Available with scope: events */

  events: [
    {
      name: "signup button (header)",
      count: 14,
      percentage: 0.1129,
      pages: [
        {
          path: "/",
          count: 13,
          percentage: 0.9286
        },
        {
          path: "/pricing",
          count: 1,
          percentage: 0.0714
        }
      ]
    },
    // ...
  ]
}
Reading scroll_depth
average_percentage is the mean deepest point reached, and measured_visits is how many visits that average is drawn from. It is always a sample: the reading is sent as the visitor leaves and some browsers don't give the script the chance, so measured_visits is lower than page_views, often well below it.
reached_at_least is cumulative. Each row is the share of measured visits that got at least that far down the page, so percent: 0 is always 100 and the rows only ever fall from there. The drop between two rows is where people stopped.
js
// "what share read past the halfway mark?"
const half = page.scroll_depth.reached_at_least.find(r => r.percent === 50)
console.log(half.visitors_percentage) // 65
Depth is measured against the page's content block, not the whole document, so a long footer doesn't make a full read look like 75%. Reaching 100% means the bottom of the content was on screen, not that it was read. See scroll depth for how the content block is found and how to tag it yourself.
An absent scroll_depth means "not measured", never zero. Pages shorter than the screen have nothing to scroll and are left out, as are pages whose visits all predate the feature. Check for the key rather than reading through it.
Plan Limits
Your plan shapes what comes back:
- Retention.
date_fromis clamped to your plan's retention window (12 months on Plus, unlimited on Scale), so asking for older data returns the oldest data you still have rather than an error. - Energy data. The
energyblock and the per-page carbon figures need carbon reporting, which is on Plus and Scale. - Custom events. The
eventsblock is on Plus and Scale. - AI agents. The
ai_agentsblock is on Plus and Scale. - Scroll depth. On every plan, Free included.
A block you aren't entitled to is left out of the response rather than returned empty, so check for the key before reading it.
Fair Use
Please keep requests to a sensible rate, around 20 per minute. The data is aggregated daily, so polling more often than that won't show you anything new. If you need a higher rate, get in touch.