
Appearance
Scroll Depth
Available onevery plan
Scroll depth shows how far down a page your visitors get. It comes from the same script that records page views, adds no extra requests, and is anonymous like everything else in Cabin.
What is measured
Each visit records the deepest point it reached, as a percentage of the page's content. It's sent once, when the visitor leaves the page.
The percentage is measured against the page's content, not the whole document, so a long footer doesn't make a full read look like 75%. See what counts as the page.
Where to find it
On the dashboard, the Attention row shows your site's average scroll depth. The small strip beside it is a picture of a page: solid at the top and fading downward as visitors fall away. Hover a band for the exact share who got that far.
In the page peek, open any page from Top Pages and switch to the Attention tab for the same figures for that page, plus a bigger version of the strip as a list.
Reading the heat map
Each row is the share of visitors who reached at least that far down the page. The 0% row is everyone, and the rows only ever fall from there.
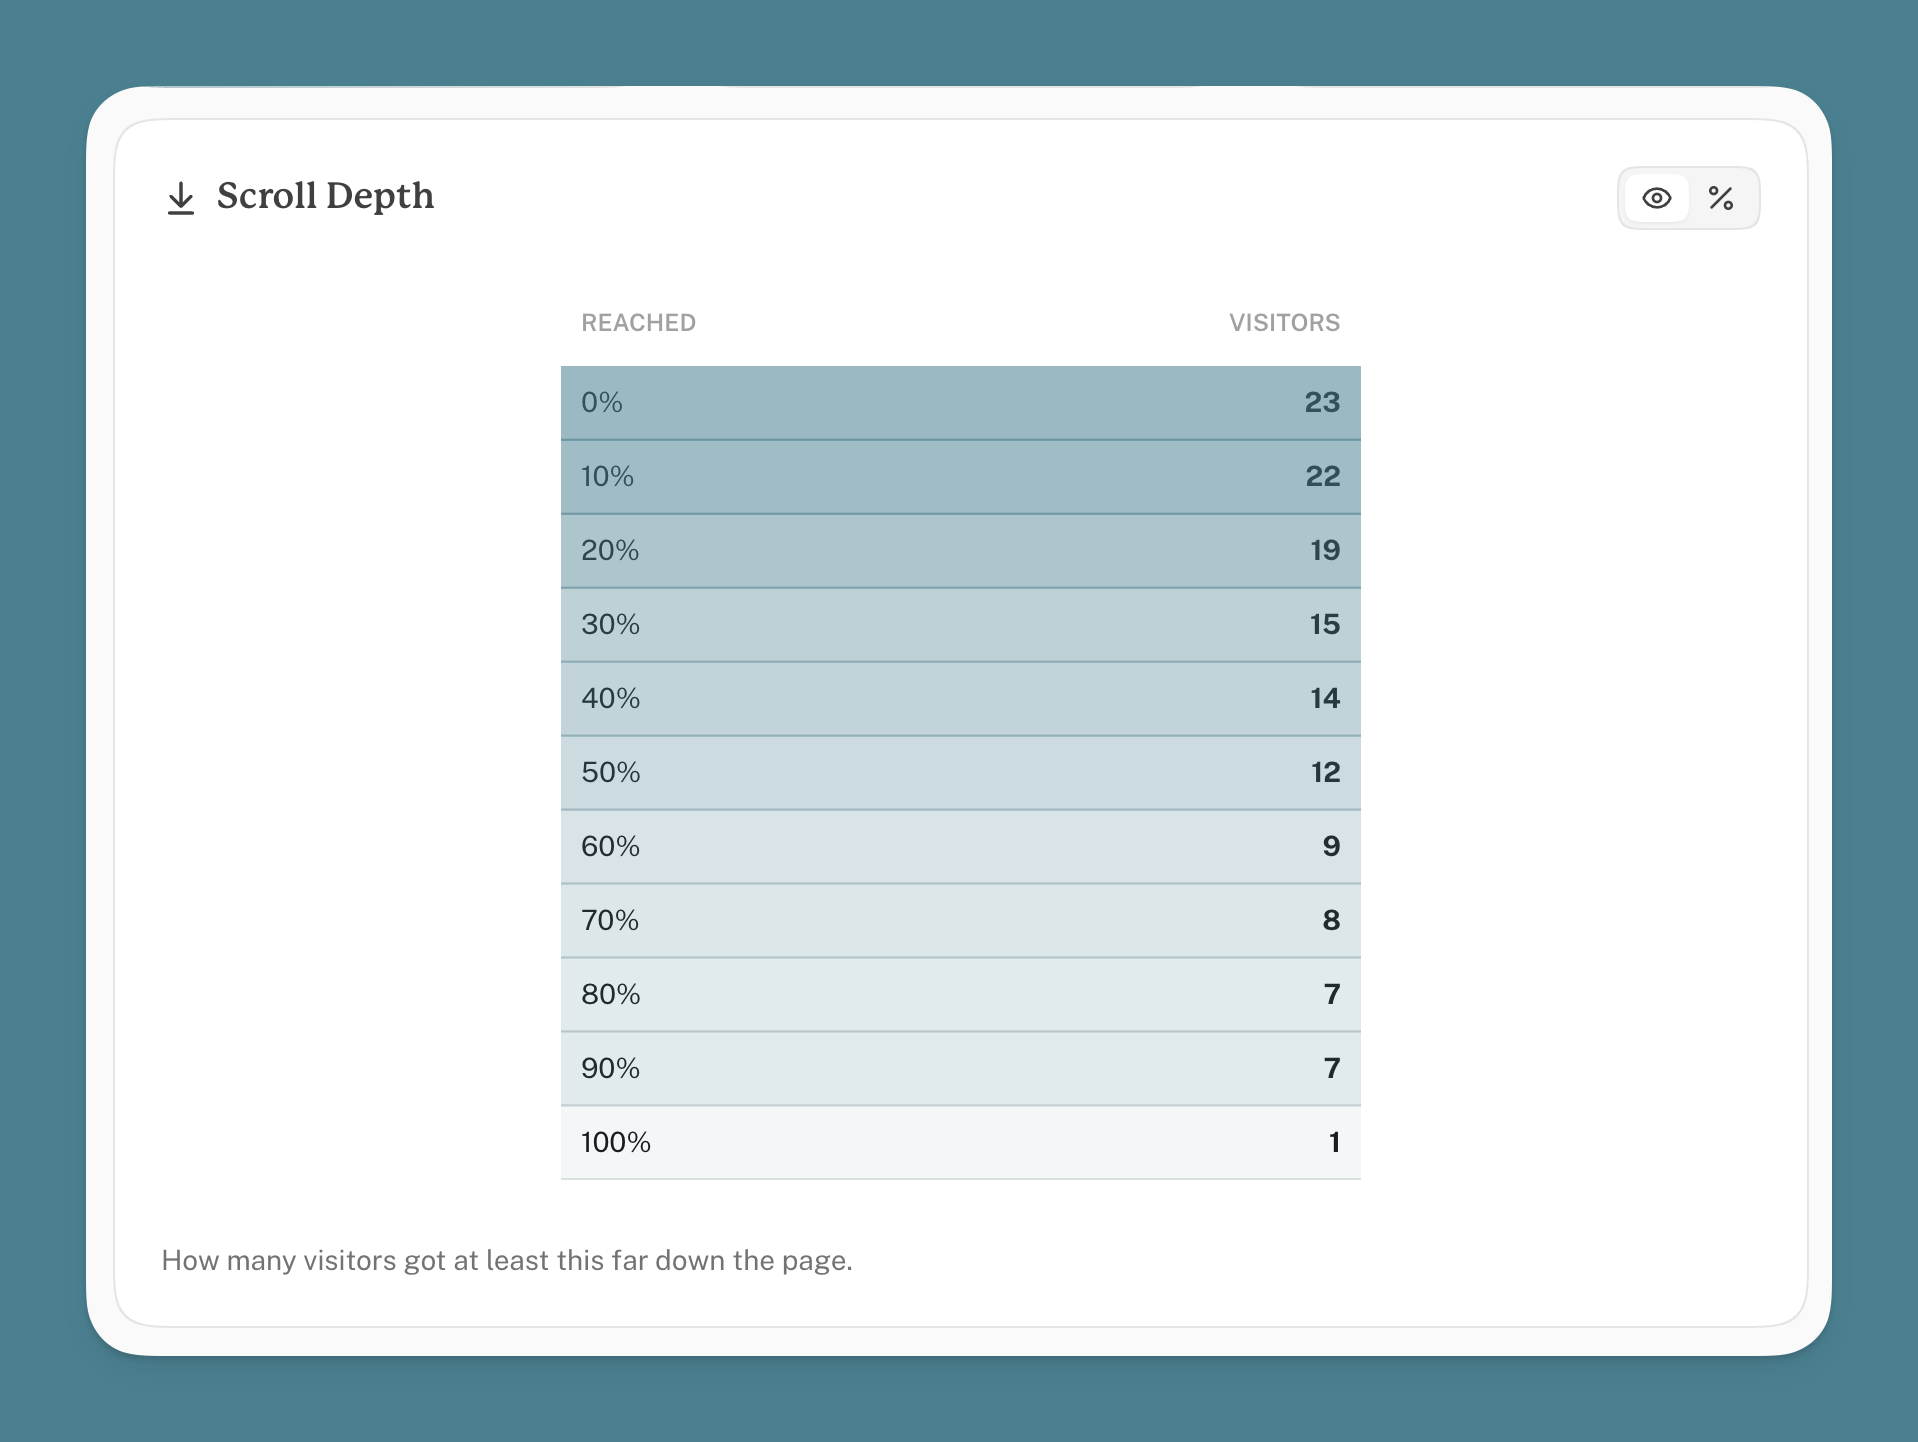
The drop between two rows is where people stopped. A big drop near the top means most visitors never scrolled. A 100% row not far below the rest means most who started kept going to the end.
Reaching 100% means the bottom of the content was on screen, not that it was read. Someone who flicks straight to the end counts.
What counts as the page
Cabin measures depth against the content block, found in this order:
- An element with
data-cabin-content, if you've added one. - Otherwise the first
<article>or<main>. - Otherwise the whole document, cut off at the first
<footer>.
If your layout has no <article> or <main>, or they wrap the sidebar and comments as well as the post, tell Cabin where the content is:
html
<div data-cabin-content>
  <!-- the article body -->
</div>
That's one of two tags scroll depth understands; the other is in the next section.
Apps, dashboards and panels
Most sites scroll the whole window. Apps often don't: they keep the header and sidebar fixed and scroll a panel in the middle. Cabin follows whichever one actually moves, so a dashboard-style layout is measured the same as an ordinary page, and you don't need to do anything.
If your layout is unusual enough that Cabin picks the wrong element, point at the right one:
html
<div data-cabin-scroll-root>
  <!-- the part of the page that scrolls -->
</div>
The two attributes
These are the only two tags scroll depth has, and they answer different questions.
| What it answers | Add it when | |
|---|---|---|
data-cabin-content | Which part of the page counts as the content? | Your page has no <article> or <main>, or one that wraps the sidebar and comments too |
data-cabin-scroll-root | Which element does the scrolling? | Cabin picks the wrong panel in an app layout |
Put another way: the scroll root is where the scrollbar is, and the content is the part inside it you want measured. On an ordinary site you never think about the first one, because the answer is the window and that's what Cabin uses unless something tells it otherwise.
html
<body>
  <header>fixed, never scrolls</header>

  <div data-cabin-scroll-root>
    <!-- the bit that moves -->
    <article data-cabin-content>
      <!-- the bit that counts -->
    </article>
    <footer>tall, shouldn't count towards the reading</footer>
  </div>
</body>
They're independent, so you might need one and not the other, and most sites need neither. Only the first tagged element of each is used.
Pages that grow as you scroll
Scroll depth is a percentage, and a percentage needs a total. On an article the total is fixed, so the figure means what you'd expect.
On a feed, or a page with a Load more button, the page gets longer while the visitor reads. The total keeps moving, and the percentage moves with it:
- Someone reads to the bottom of what's loaded. That's 100%.
- They press Load more. The page is now three times longer and they haven't read any of the new part.
- They're now at 33%.
Nothing is wrong with the number. It's a true reading of how far they got through what had loaded. But it means the percentage can go down as someone gets more involved, and on a feed that keeps loading ahead of the reader nobody ever reaches the bottom, so 100% never really happens.
What to do instead
On pages like these, count the loads rather than reading the percentage. Put an event on the button:
html
<button data-cabin-event="Load more">Load more</button>Now you can see how many times people asked for more, which is the question you were really asking. It rises with interest, rather than falling.
The scroll depth figure is still worth a look on those pages, just don't read it as "how far down they got".
What isn't counted
- Pages shorter than the screen. Nothing to scroll, so the visit is recorded as unmeasured and left out. The same goes for a page whose content block is short enough to fit on screen in full: there's no scrolling to measure, so Cabin falls back to measuring against the page instead of reporting a read nobody did.
- Visits that end abruptly. The reading is sent as the visitor leaves, and some browsers don't give the script the chance, so scroll depth (like time on page) comes from a sample of visits. The number of measured visits is shown under the average.
- Bots and scrapers. They don't run the script. AI crawlers are counted separately in AI Traffic.
Plans
Scroll depth is on every plan, Free included. It has been recorded for every site since it launched, so if your dashboard is new to you there may already be history to look at.